Has the pandemic been overblown?

Status
Not open for further replies.
Would 500,000 not have been the worst result if we didn't go into lockdown and carried on as normal?

The reason it's not kicked off as much as we were warned is because we took measures to prevent it surely?
Hence the downgrade to 200,000.

They will still have been given numbers, not for public consumption, that they will be working with.


Looking at the current state of affairs worldwide and what we've seen in person - is this virus less of a danger (to the majority of us) than we initially thought?

Some figures/food for thought:


  • Death rate by age group in Massachusetts
Logon or register to see this image

(https://www.mass.gov/doc/covid-19-dashboard-may-6-2020/download)

  • Rate of hospitalisation is now estimated to be 102.5 per 100,000 infections, or 1% of cases require hospitalisation.
  • (CDC, updated weekly)
Read this first - One school, 25 bereavements: Essex head fears emotional impact of Covid-19
 
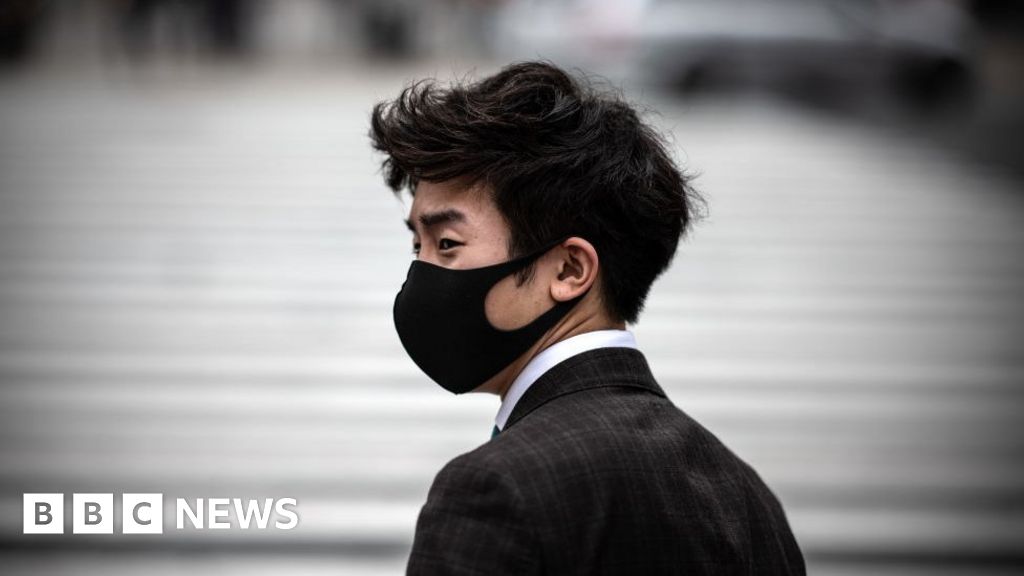
What about Japan? Bizarre

Probably because the general health of the population is far better than ours. Plus they’ve been wearing facemasks for years.

When all this has died down it would be interesting to see out of how many that have died we’re heavy smokers/drinkers, overweight or had substance abuse issues.
 
Probably because the general health of the population is far better than ours. Plus they’ve been wearing facemasks for years.

When all this has died down it would be interesting to see out of how many that have died we’re heavy smokers/drinkers, overweight or had substance abuse issues.

There’s already some very good research on that:


You’re looking for the chart on page 11 of the document (page 13 overall)

In a nutshell, anything to the RIGHT of the middle red line - increased risk, anything to the LEFT - decreased risk, anything that crosses the line - too close to call.

increased or decreased risk is relative to something else eg risk relative to those aged 40-49, those who don’t smoke, those who don’t have diabetes etc. These are marked as “(ref)”
 
Last edited:
There’s already some very good research on that:


You’re looking for the chart on page 11 of the document (page 13 overall)

In a nutshell, anything to the RIGHT of the middle red line - increased risk, anything to the LEFT - decreased risk, anything that crosses the line - too close to call.

increased or decreased risk is relative to something else eg risk relative to those aged 40-49, those who don’t smoke, those who don’t have diabetes etc. These are marked as “(ref)”
Very good, thank you!
 
I’m 80 next year so vulnerable and whilst I accept death is just around the corner I’m not frightened of that BUT based on on what I’ve seen on tv I don’t want to go the way that COVID19 takes u

I completely agree mate. And as the virus reduces in society its up to each individual to assess the risk to their own health. I hope my grandma will stay indoors out of its way until a cure/vaccine is found, but it is her (dare I say it, limited) life, at the end of the day. Her choice.
 
This is why it's important to look at the excess deaths statistics. They blow this theory out of the water I'm afraid.

Totally inaccurate though.
People who were thermally I’ll with cancer died why symptomatic and cause of death registered as Covid which totally screws up the statistics.
65k more deaths above the per annum average? Aye, really overblown.

That's after a very mild winter anarl.

Link in your findings please? Or you’ve just made that up.
 
Last edited:
Totally inaccurate though.
People who were thermally I’ll with cancer died why symptomatic and cause of death registered as Covid which totally screws up the statistics.
As has been pointed out elsewhere that has to be balanced against deaths from other causes falling away during lockdown, such as accidents, heart attacks caused by over exertion, that sort of thing. Also the mild winter and the fact that the first three months of the year were down in terms of excess deaths before Covid took hold. There's no wholly accurate picture, but excess deaths is as good as we'll get.
Link in your findings please? Or you’ve just made that up

That's from the 5th June if that's what he's referring to
 
Last edited:
As has been pointed out elsewhere that has to be balanced against deaths from other causes falling away during lockdown, such as accidents, heart attacks caused by over exertion, that sort of thing. Also the mild winter and the fact that the first three months of the year were down in terms of excess deaths before Covid took hold. There's no wholly accurate picture, but excess deaths is as good as we'll get.


That's from the 5th June if that's what he's referring to
As has been pointed out elsewhere that has to be balanced against deaths from other causes falling away during lockdown, such as accidents, heart attacks caused by over exersion, that sort of thing. Also the mild winter and the fact that the first three months of the year were down in terms of excess deaths before Covid took hold. There's no wholly accurate picture, but excess deaths is as good as we'll get.

You also have to balance the fact that since records began since March no pneumonia cases have been recorded fist time in history.
This needs to be taken into consideration.
 
Totally inaccurate though.
People who were thermally I’ll with cancer died why symptomatic and cause of death registered as Covid which totally screws up the statistics.


Link in your findings please? Or you’ve just made that up.

See above. Must be the ONS who are making it up.

I deal in death daily as part of my job (no, I'm not a serial killer). Do you not think I've noticed a huge increase in my workload?
 
Yes. So many of these deaths of people "with coronavirus" have been people that would have died soon anyway. Its like saying x number of people died whilst wearing socks. Doesnt mean socks are deadly.
Absolute shit.
 
Yes and no. Guess it happened to quickly but in hindsight, vulnerable people should of been protected while fitter people should of been left to keep the economy going.
Younger and fitter people were hitting the NHS in their droves.

Just because it's less likely to kill those younger, doesn't mean they should be exposed to it.

Lockdown was to stop the NHS being overwhelmed. Not to stop the elderly dying.

It's staggering how many didn't, haven't or continue to not understand this.
 
You also have to balance the fact that since records began since March no pneumonia cases have been recorded fist time in history.
This needs to be taken into consideration.
That potentially means the Covid stats are even worse, being a reflection of the moderate winter we had.
 
Wonder how much lockdown is playing into that, and not about virus transmission and deaths, but other average yearly deaths. Fewer roads deaths? Fewer alcohol fueled street deaths? And so on.

Said on another thread that mate of mine is a&e doc. Said they'd had fuck all to do for months. Fri & Sat night normally fights & drunks, weekends sporting injuries & home accidents. Basically none of any since March.
 
Did you get COVID? Imgaine your view changes massively if you experienced it either directly or indirectly.
 
There’s already some very good research on that:


You’re looking for the chart on page 11 of the document (page 13 overall)

In a nutshell, anything to the RIGHT of the middle red line - increased risk, anything to the LEFT - decreased risk, anything that crosses the line - too close to call.

increased or decreased risk is relative to something else eg risk relative to those aged 40-49, those who don’t smoke, those who don’t have diabetes etc. These are marked as “(ref)”

i need to get back on the tabs I think
 
Status
Not open for further replies.

Back
Top